Friday, December 08, 2006

the internet archipelago

the internet is one of the most powerful global and globalizing forces whose existence has revolutionized the way in which many people live and many corporations do business. in fact, its existence has fostered the creation of vast stores of data, not unlike this blog, and has made possible the experiment that is arch451 beyond mega. despite all its acclaim, the internet is still largely confined to developed countries and will forever be bound by infrastructure and language. (see also a brief history of the internet). this project seeks to explore and document these boundaries and proposes the creation of internet archipelagos to surmount these boundaries and globalize the internet.

below, the project is presented in two parts. the first part focuses on the creation of a global map of the internet and the second elaborates on the proposed internet archipelago.

1.0 global mapimation
in his essay entitled the agency of mapping, james corner outlines several techniques for mapping that goes beyond a literal tracing of a condition to discover its latent potential. although this essay served as a point of departure for this project, its techniques had to be reconsidered and adapted to a new medium: an animated three-dimensional map, or mapimation.

a mapimation of the internet was created, filtered through the lens of language (and, to a lesser extent, internet infrastructure). it was spurred by a disappointing statistic on web content that revealed the dominance of ten languages on the internet. english accounted for nearly 2/3 of internet content; english together with nine other languages (in order: japanese, german, chinese, french, spanish, russian, italian, portuguese, korean) account for over 95% of internet content. accordingly, countless languages are underrepresented and countless people are restricted or completely prohibited from access to information on the internet.

this mapping is limited to countries are home to a significant population speaking an internet language (a significant population is defined as at least 100,000 first tongue speakers). the political map of the world is rearranged based on internet language populations to create the language archipelago.


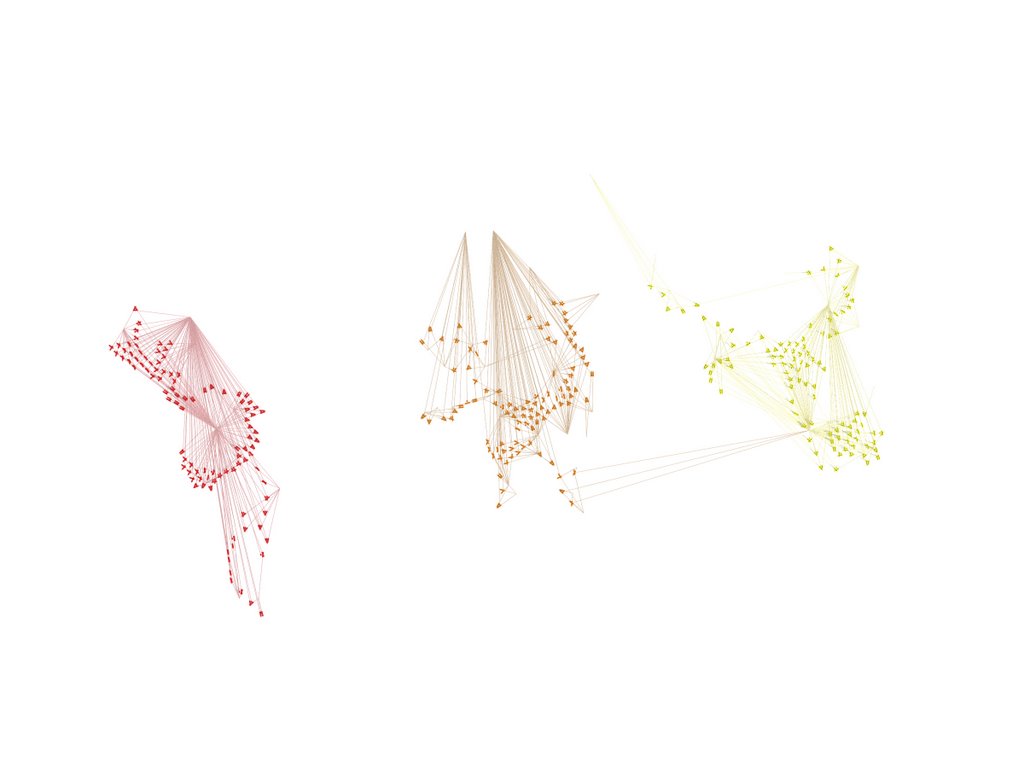
img_1.1 the language archipelago / ascendancy

the united states is placed at the center of the language archipelago for several reasons. it is the only country that has a significant population speaking all ten internet languages. it has the most extensive internet infrastructure. and it was the birthplace of the internet. from there, all the other internet countries are arranged in rays corresponding to the countries’ dominant internet language based on their ascendancy. the national flag at the end of each ray is used as a visual legend to key the ray’s language. this map illustrates the dominant role of the world’s superpowers on in internet and reveal the circumstance of countries at the periphery.


img_1.2 the language archipelago / continuum

in this map, all the countries are woven together by a language continuum. this map illustrates the complex web of language that exists in the world and the potential of the internet to provide a common ground for these languages.


img_1.3 the language archipelago / perspective

each country is also placed in 3d space based upon its internet infrastructure. the internet is of course a physical network bound by infrastructure. the height of a country in the language archipelago is inversely related to the number of ip address per capita allocated to that country. (the number of ip address controls the number of devices that can simultaneously access the internet). the united states is allocated roughly 2 ip addresses per person and is placed to the bottom of the language archipelago. niger, which is allocated a total of 256 ip addresses, is placed at the top of the language archipelago.


anim_1.4 the language archipelago / mapimation

here, the known political world is morphed into the language archipelago. the lines of continuum are then constructed.


img_1.5 gdp of the language archipelago

here, the concentration of gross domestic product is clearly at the center of the archipelago. because the internet is so closely tied to its infrastructure, it stands to reason that wealthier countries have more internet .


img_1.6 aids in the language archipelago

notice that there is a tendency for aids to me more prevalent at the periphery of the archipelago. aids and other socioeconomic struggles seem to be inversely related to gdp and inversely related to the internet. it seems possible that the spread of the internet to and within these nations could provide the information and knowledge to begin to alleviate these problems and bring about change.

2.0 global network archipelago
in the second phase of the project, an architectural response was made to the language archipelago. this mapping revealed certain inequities that existed on the internet and within its infrastructure. there is the potential for the internet to facilitate the exchange of ideas and information at a truly global scale, and this project seeks to promote this through the creation of internet archipelagos.


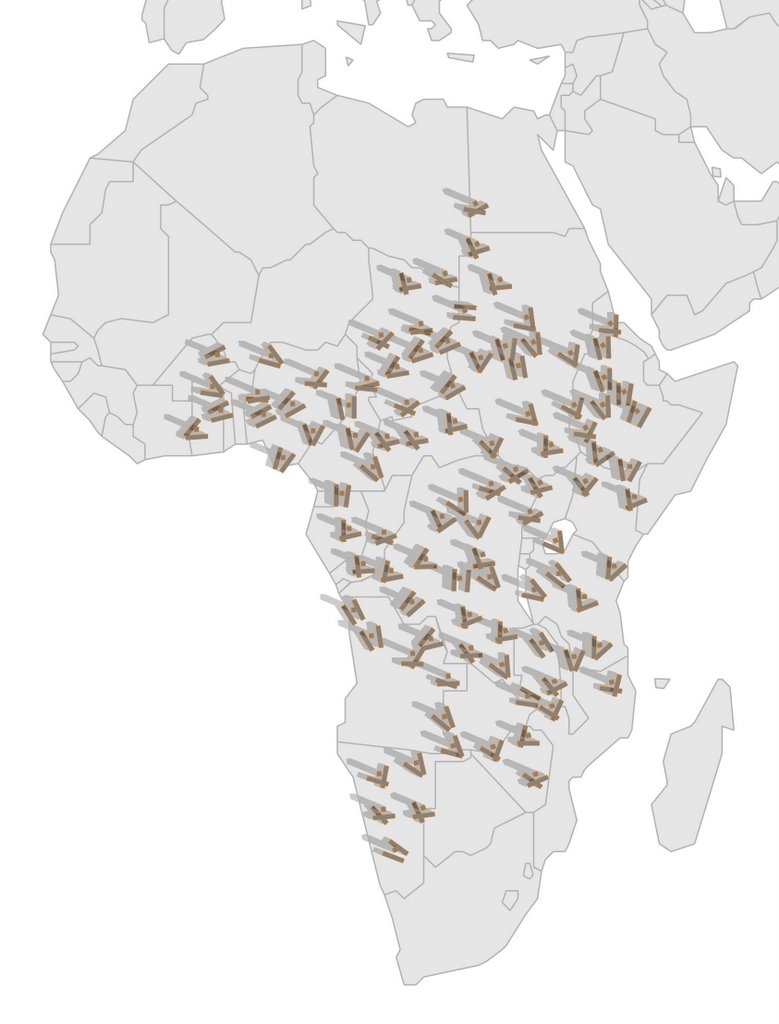
img_2.1 the logic of the internet archipelago

each of these archipelagos is made up of a series of installations, connected to one another by antenna arrays carried by hot-air balloons. as such, the archipelagos are able to cover vast territories without depending on the existing infrastructure.

the installation is comprised of three volumes, each of which responds to a particular condition unique to the location of the installation and houses functions specific to this condition:

* the internet
* language
* local need (such as aids relief, disaster relief, etc.)

each of these volumes also serves to map the condition to which it responds. it orients itself towards the condition and derives its size from the weight of the condition. as the condition changes, so too does the installation. to determine the form of the installation, an algorithm calculates the relationship between the installation and each condition at various moments in time, and generates form accordingly. to accomplish this, the conditions are mapped and their tendencies for change animated. (see the final algorithm)


img_2.2 a single animation


anim_2.3 a single animation, morphing


anim_2.4 an internet archipelago


anim_2.5 a single installation, dynamically changing in a static world


anim_2.6 a single installation, morphing

this project walks the line between the real and the virtual. its function is closely tied to the real world and the current state of the internet and ambitiously seeks to change it. its form, however, is much more grounded in the virtual world. it seeks to explore the possibility of architecture to continuously respond to dynamic conditions and in fact affect these conditions through its change. an example of this potential: the local needs volume moves and grows as the aids epidmic spreads toward it. this physical growth informs its users, who can respond to this spread and stem its progress. these actions are then reflected in the form of the installation.

Tuesday, December 05, 2006

gna 3.0

based on monday's desk crit with ron and vinnie, i began to explore making my form dynamic. it had proved to be a real headache. the script functionality that i really need is not yet available, so i have to manually run the algorithm on each frame, manually generate each frame, and the put all the frames together using quicktime. this first video is short, but illustrates the direction i am heading. the idea is to use a gently tapered form that 'points' towards the condition it responds to and morphes shapes as this condition changes. click below for the quicktime video:


below is a plan view of all the frames:

Monday, December 04, 2006

gna 2.1

in my previous post, i focused primarily on the new internet archipelago as a system. to reiterate a very important point, the scale of each installation as shown in the previous posts is extremely exaggerated so that their relationship to one another can be understood at a large scale.

individual installation
below is an explanation of a single installation, including its form and its use.


img 1.1 - single installation


img 2.1 - the installation from above. the installation is made up of three volumes, each of which responds to a particular condition unique to the location of the installation:
  • the internet
  • language
  • local need (such as aids relief, disaster relief, etc.)
each volume is oriented toward the nearest epicenter of each condition as mapped in formZ and interpreted by the algorithm.

now we will look at each of the volumes individually:


img 2-2 - the internet volume. the internet volume is made up of three sub-volumes. each of these sub-volumes responds to a specific router within the internet infrastructure. the lowermost sub-volume orients itself to the nearest local router; the middle sub-volume orients itself to the nearest mid-level router; the uppermost volume orients itself to the nearest mega-router. (the classification of each router is based on data relating to its prominence in the internet infrastructure.) the vertical dimension of each of these sub-volumes is determined by the distance data travels to move from the installation to the super-router.

this volume is used to house the equipment necessary to provide internet access to the installation. the logic internet service in the internet archipelago is explained below.


img 2.3 - the language volume. the primary language volume orients itself toward the nearest language epicenter. it is then bombarded by parasitic forms in order to reflect the complexity of language specific to the location of the installation. each parasite represents a language epicenter within 200 miles; its size reflects the number of speakers present at this epicenter. accordingly, in areas with a great diversity of language, the form language volume becomes quite complex.

this volume provides computers for internet access in each local language. it also serves as a digital repository and archive for language in order to preserve language and facilitate the growth of other languages on the internet.


img 2.4 - the local needs volume. the form of this volume is determined in the same way as the language volume, as explained above.

this volumes would provide a response to the local need (for example, an aids clinic or a relief headquarters or a polling booth).

logic of the archipelago
it is important to understand how the internet archipelago functions as a whole. the basic concept is to provide and easy and rapid method for expanding the internet infrastructure. the first installation in each archipelago is hard-wired into the existing infrastructure. it then flies a small balloon carrying a radio antenna to a height of 1 miles. the next installation is places within 178 miles. it too flies a balloon to a height of one mile. at this distance, these balloons share line of sight and can communicate using radio waves. each successive installation is placed within 178 miles of an existing installation, and the archipelago grows.


img 3.1 - the archipelago. here, three installation as shown. the earth's curvature and the size of each installation is extremely exaggerated. note the line of sight connection between each balloon. for the sake of comparison, 178 miles is the distance from clemson to florence or from genoa to venice.

Thursday, November 30, 2006

layout test

i am experimenting with some techniques to improve the presentation of information with our blogs. its seems that a lot of us have really long entries, so maybe some section headings will make them easier to read.


section heading

so there is a simple section heading made possible by a quick change to the template html/css.

i also thought that it would be interesting to have portions of the blog expand and collapse.


click here to check it out

here is the hidden text. you can click the link again to collapse this text again. you can also place images in this area:

to collapse this area, you can also click here.


ron, this is what i had in mind for the sumo post. let me know what you think. this think it could be nice to embed some of the process photos in there expanding/collapsing areas.

final review format

my biggest complaint about our mid-semester review was the lack of visual contact. it is always nice to be able to see your critic so you can interpret what he really thinks about your project, so you know if he is questioning you because he thinks your project/premise is really bad or because he is really impressed and what you to take it farther. i would imagine that the jurors felt a similar sentiment, as they had no way of knowing how we were taking their criticism. while i was in charleston, i took a class via polycom, a self-contained video conferencing device. the video hardly every froze and you could control the camera at the other end. it allowed for fairly fluid interaction; in fact, we gave a presentation to the class from our end. i am not sure if this technology is available to ron and other global jurors or if it can handle more that two locations. i do think that it could be a good medium for a/v communication that could be supplemented by blog posts and other web content for graphic communication.

i do not this that we should use breeze again. it seemed very slow and buggy. i recall that it repeatedly crashed peoples computers. its biggest flaw, in my opinion, is it the fact that you have to push a button to talk. this made it feel like we were in a lecture, not engaging in an open, fluid dialogue. someone would speak, then there would be a pause while everyone waited to make sure they were done and that there was not a lag, and then the next person would begin and repeat. accordingly, the conversation was choppy. perhaps a skype group chat with blog/vyew to supplement would be better.

Wednesday, November 29, 2006

gna 2.0

based on the feedback, i made several changes to the algorithm. my first step was to create a funtion to map the points each volume was responding to. in the process of doing this, i found a bug in the previous algorithm which took me a while to fix. i also rewrote the placement function, so the archipelago generated is much more 'linear'. in appearence, the current algorithm is very similar to the previous, but the inner working have some major revisions.

i also played around with using metaballs. i didnt like the forms it was generating, so i put that exploration on hold. i may come back to it.

i also looked into animating the points. i posted on the formz forum for some help. the functions if need will not be available until formz 6.1 is released. i was told that they were hoping to release this upgrade by january. so i may be able to explore that further if the new version is released.

the next step is to have the size/form of each volume also respond to the conditions. i think that i have a good backbone in place, so now i can really begin to experiment.

here are some images of the current algorithm:


here is a .txt file of the algorithm

Monday, November 20, 2006

global network archipelago

as is proposed in a previous blog entry, the intent of my megaproposal is to create a network archipelago to facilitate the spread of the internet through the creation of a network of small installations. as i set out to create an algorithm to create this architecture, i first considered the form and program of each individual installation. the program would be based on:
  1. the internet
  2. language
  3. local need factor
the first two program functions would work together to provide interenet access and foster the development of more languages on the internet. the third program function would provide a response to a local need. i noticed in my mapimation that areas with low internet development tended to have high instability. this third program function could serve to house aids clinics, polling booths, disaster relief or refugee camp headquarters, etc.

each of these functions would be housed in a separate volume, and this volume's placement would respond to the condition of that function at the installation. to determine this, i mapped epicenter points for language, internet, and local needs across the globe. my algorithm analyzes these points at each installation and places each volume accordingly. currently, each volume represents a 40' shipping container.

what i find particularly intriguing about this approach is that the architecture becomes a map of several conditions. these condition are dynamic, and each installation could respond to the instantaneous condition at its creation. if this network were constructed, it would serves as a three dimensional database of these condition. the algorithm could be reversed in order to understand these conditions at a specific point in time.

the next iteration of the algorithm:
  • size each volume to respond in some way to its condition
  • create dynamic conditions so that the archipelago responds to differently over time

below are a few images of the archipelago. an important note: these drawings are NOT to scale. each volume represents a 40' shipping container. they have been exaggerated to show relationships over great geographical distances.


perspective


plan


plan detail