following graphics courtesy of the un's international strategy for disaster reduction

frequency of natural disaster by year, 1900-2005. divided into three disaster types: biological (epidemics and insect infestations), geological (earthquakes, tsunamis, and volcanic eruptions), & hydrometeorological (floods and wave surges, storms, droughts, and landslides & avalanches).it is clear that there is a generally increasing trend in disasters, especially hydormeteorological and biological disasters. the aids epidemic worldwide (and especially in africa) is included in these statistics, which explains the increase in biological disasters. the increase in hydrometeorological disasters can be attributed to the general increase in global temperature which results in more disasters of this type.

disaster type by region/continent, 1991-2006. this graphic indicates the various types of natural disasters that affect each area of the globe.
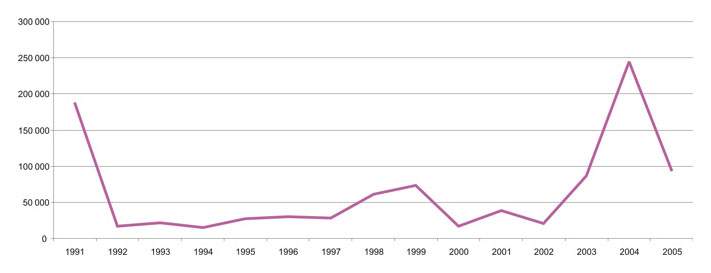
deaths caused by natural disasters, 1991-2005. peak in 2004 is direct result of tsunamis that struck southern asia.
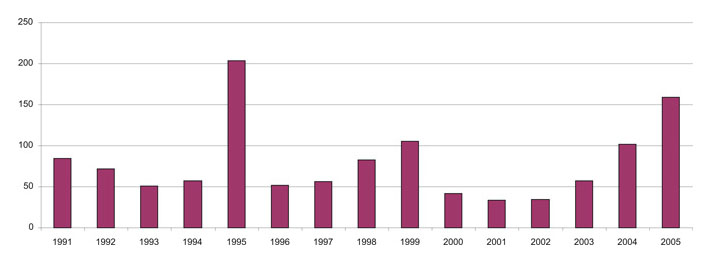
cost of natural disasters worldwide, in billions of USD, inflation adjusted to 2005.
it is also important that we consider the implication of future changes in environmental patterns that will affect the way we live. it seems clear today that the global warming is a real issue and will result in an increase in sea level in the coming centuries. whether this global warming is a result of humans' actions or a natural climatological trend is inconsequential. the fact of the matter is that a rise in sea level will affect a huge number of people. approx. 10.5% of the earth population lives within 10m of sea level and is thus at risk with impending rise in sea level. the following graphics are were taken from research conducted for the epa.

map of charleston, sc. shows current water level.

map of charleston, sc. shows 'medium scenario' prediction for water level in 2075 based on current trend in sea-level increase.

charleston after the change in sea-level change of 1m. the battery sea wall would no longer be able to protect the historic city from the water, escpecially during a hurricane.
it is clear from these graphics that an increase in sea level is a real issue that designers must content with. since much of the worlds wealth is concentrated in large coastal cities (new york city, tokyo, hong kong, london, etc.) it follows that mega structures are often proposed in these areas. as a result, it is important to consider the long term environmental changes that a mega building must endure.

1 comment:
very nice research jason. i am looking, however, for that one image that involves speculation on your part.
Post a Comment