i am going to focus on the internet and world wide web as they relate to language. i also hope to make the infrastructure of the internet apparent through the map. language is of course a limiting factor in communication and thus the internet. the languages of the 313 billion website online:
- english / 68.4%
- japanese / 5.9%
- german / 5.8%
- chinese / 3.9%
- french / 3.0%
- spanish / 2.4%
- russian / 1.9%
- italian / 1.6%
- portuguese / 1.4%
- korean / 1.3%
- all others / 4.6%
more to come on language of the internet in a megablog post.
i will map the path that data takes from the u.s. to each country that significantly speaks one of the above ten languages. a language will defined as significantly spoken if it is an official language for the country, an official language within a region of the country, and/or spoken by more that 1% of the inhabitants of the country. as such, some countries will fall into multiple language categories (the u.s., for example, belongs to each language category)
here is the storyboard:

keyframe01: the data begins to hop from origin. appears as continuous stream of packets (represented by small spheres or other simple geometric shape). the height of each hop is determined by the total number of packets that make the same hop.

keyframe02: the data continues to stream from origin. it continues to hop to its final destination, an internet server in each country. the order is determined by the ping time of each final destination. the data leaves a trail/residue along the path that it travels. this begins to create spatial implications that indicate the structure of the internetwork.
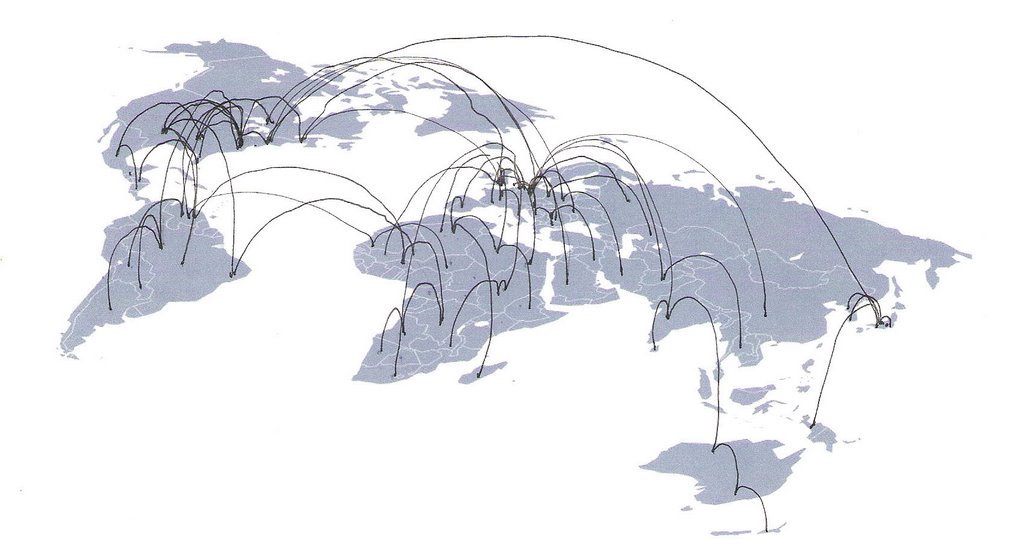
keyframe03: all the packets have reached their final destination. the residues of their hops creates an interwoven fabric across the globe. the animation pauses here briefly.
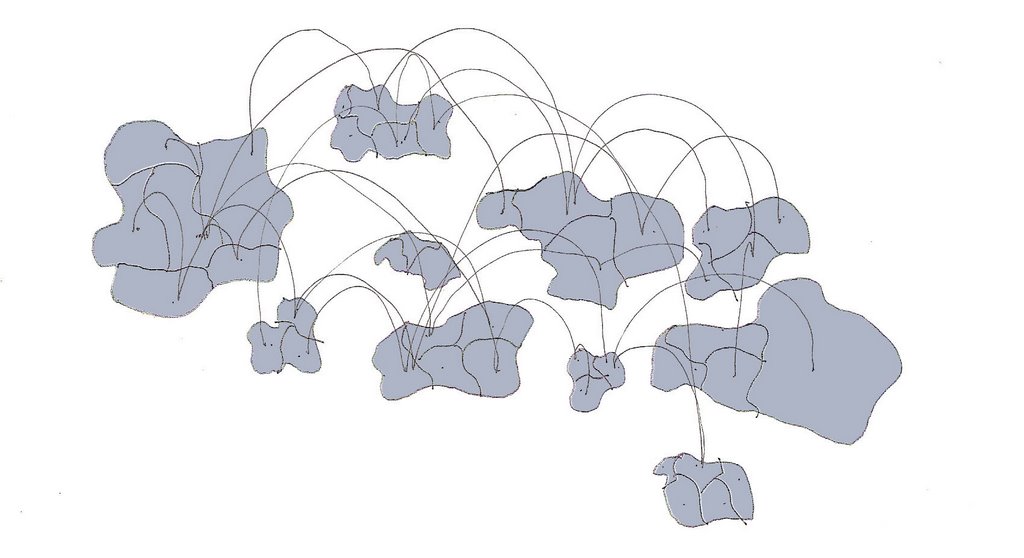
keyframe04: the globe is reorganized to create language continents. the movement of the countries is animated. the residue of each hop is moved with each country. the animation pauses briefly. then, each packet hops back to the origin along the reorganized paths. this intent is to show not only the 'language continents' but the dependence on the infrastructure which pays no mind to language barriers.

keyframe05: all the residuals are gone. here is the globe reorganized by language.

2 comments:
very nice start. i think keyframing is helpful. i might suggest that you think sectionally as well. do the flat contentent begin to have topography based upon a certain data set perhaps? also, can the points that reference certain areas on the current continents shift was well, creating another morphing system? i think in all the animations, it will be interesting to see every frame all in a single image as well.
I love the language continents. Good way to look at it. It would be interesting to see phone transmissions from back in the day in the same sense, because you can compare the two. Just a thought.
Post a Comment